

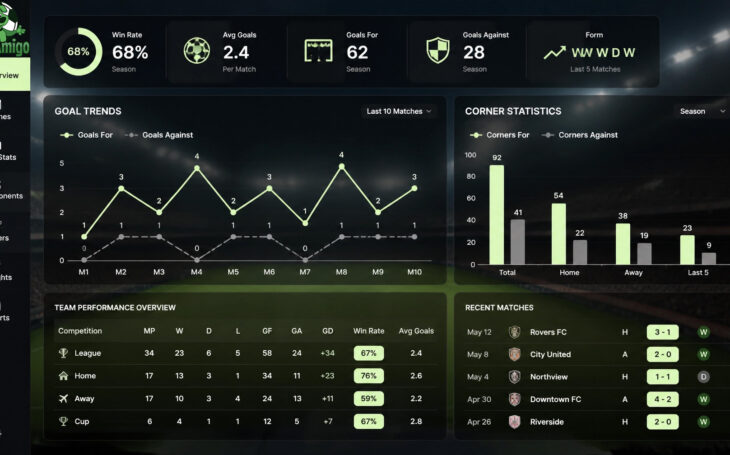
Football Data Analysis; most punters start their Saturday morning exactly the same way. They open a betting app, look at a few fixtures, and think, “Yeah, Liverpool look good for a win today.” It’s a gut feeling. Maybe they’ve seen a quick highlight on the news or heard a “pro” tipster on Twitter mention a “lock.”
The problem? The bookmakers aren’t using gut feelings. They are using massive server rooms filled with complex algorithms and historical data to set their prices. If you want to beat them, you need to stop guessing and start analysing.
The good news is that you don’t need a degree in maths to do this. You just need to know which numbers actually matter. This guide will walk you through the basics of football data analysis so you can move from a “gambler” to a data-driven trader.
When you first dive into football stats, it’s easy to get overwhelmed. You’ll see possession percentages, xG (expected goals), pass completion rates, and distance covered. While those are great for pundits on TV, they aren’t always the most useful for finding betting value.
For a beginner, it is much better to focus on the “Three Pillars.” These are the markets where the most consistent data is available.
Goals are the currency of football. The most popular markets are Over 2.5 goals and Both Teams to Score (BTTS). When looking at goal data, don’t just look at the league table. A team might be top of the league but win every game 1-0. That’s great for them, but terrible for an “Over 2.5” bet.
Instead, look for the goal frequency. Check how many times in their last 10 games a team has seen three or more goals. If Team A hits Over 2.5 goals in 80% of their home games, and Team B hits it in 70% of their away games, you’ve found a potential “Goal Factory.”

Corners are often overlooked by casual punters, but they are incredibly predictable if you have the right data. A high corner count is usually a sign of sustained attacking pressure. Teams that play with wide wingers who love to cross the ball will naturally win more corners than teams that try to walk the ball through the middle.
When analysing corners, always look at the “For” and “Against” stats. If a home team averages 6 corners per game and the away team concedes 6 per game, the Over 9.5 corners market starts to look very interesting.

Betting on cards is about more than just finding “dirty” teams. It’s about the match context. Is it a local derby? Is it a relegation “six-pointer”?
You also need to factor in the referee. Some refs are “card-happy” and will reach for their pocket the moment a player looks at them funny. Others like to let the game flow. Combining a high-stakes match with a strict referee is the perfect recipe for an “Over 3.5 cards” selection.
This is where the magic happens. Once you have your data, you need to turn it into “Fair Odds.” This sounds technical, but it’s actually quite simple.
Let’s say you’re looking at a match in the Dutch Eredivisie. Your data shows that based on the last 10 games for both teams, there is a 70% chance of “Both Teams to Score.”
To find the fair odds, you divide 1 by the probability:
1 / 0.70 = 1.43
If the bookmaker is offering odds of 1.80 for BTTS, you have found massive value. Your data says the price should be 1.43, but the bookie is paying out at 1.80. Over the long run, betting on these discrepancies is how you build a profitable bankroll.
One of the biggest mistakes beginners make is looking at too small a sample size. If a team wins 5-0 once, it doesn’t mean they are a “high-scoring” team. They might have just played against a team with ten men and a backup goalkeeper.
At Footy Amigo, we always recommend looking at a minimum of 10 games. This helps smooth out the “flukes” and gives you a much clearer picture of a team’s true form. Even better, look at the Home/Away splits. Some teams are lions at home but lambs on the road. If you only look at their overall season stats, you’ll miss the most important part of the story.

Doing all this research manually takes hours. By the time you’ve checked the corner stats for the Belgian Pro League, you’ve probably missed the kickoff. This is why smart punters use automated tools.
With a tool like Footy Amigo, you don’t have to go looking for the data; the data comes to you. You can set up a “Smart Alert” that scans thousands of games across 1,800+ leagues.
For example, you could set an alert to message you on Telegram whenever a game reaches the 20th minute at 0-0, but where there have already been 5+ shots and 4+ corners. This allows you to catch the In-Play Drift and get much better odds than the pre-match market offered.
Even with the best data, you can still get caught out. Here are three things to watch out for:
Stop trying to predict the winner of the match. It’s the hardest market to get right because there are three possible outcomes (Win, Draw, Loss). Instead, focus on binary markets like Over/Under goals or Corners. These only have two outcomes, which makes your statistical edge much easier to apply and much more profitable over time.
Remember: in the world of betting, data beats luck every single day of the week.