


Expected Goals (xG); We’ve all been there. You’re looking at the weekend fixtures, and you see a team that’s won four games on the bounce. They’re playing a side that hasn’t managed a win in a month. Your gut feeling screams “home win,” but then the final whistle blows, and it’s a 0-1 upset. You’re left scratching your head, wondering how the “obvious” choice let you down.
The truth is, traditional scorelines only tell half the story. To really win at this game, you need to look under the bonnet. In this guide, we’re going to break down how to read football stats like a professional trader, moving away from “vibes” and towards data-driven decisions.
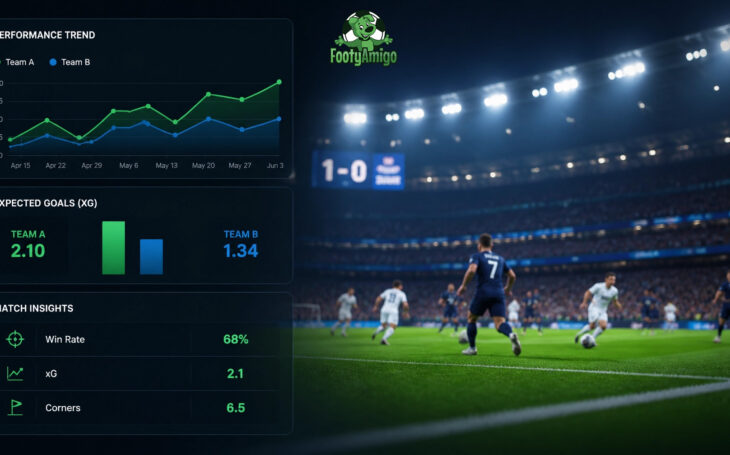
If you’ve watched Match of the Day recently, you’ve probably seen the term Expected Goals (xG) popped up on the screen. While it might sound like something out of a maths textbook, it’s actually the most powerful tool in a punter’s arsenal.

In simple terms, xG measures the quality of chances a team creates. Not every shot is equal. A tap-in from two yards out is a “high-value” chance (maybe 0.90 xG), whereas a desperate 30-yard screamer is “low-value” (maybe 0.02 xG).
By adding these numbers up, we get a much clearer picture of who actually dominated the match. If a team loses 1-0 but had an xG of 2.5 compared to their opponent’s 0.3, they were massively unlucky. Over time, those teams usually start winning again. That’s where the value is.
Bookmakers love it when punters only look at the final score. They know that “noisy” events like deflections or a goalkeeper having the game of his life can mask a team’s true performance. By tracking xG, you can spot teams that are performing better than their results suggest.
When most people talk about form, they look at the last five games and see a string of Ws or Ls. But as we just learned with xG, results can be very misleading.

To read form like a pro, you need to ask why those results happened. Did a team win three games because they were clinical, or because they played the bottom three sides in the league?
At Footy Amigo, we encourage punters to look at contextual form. This means checking:
When you combine these factors, you start to see the real picture. If you want to see how the pros handle their betting journey, checking out the Amigo Copier is a great way to learn from successful strategies that have already accounted for these variables.
Every league has its own “personality.” If you try to apply the same strategy to the Premier League as you do to the Italian Serie B, you’re going to run into trouble.

Some leagues are naturally high-scoring (looking at you, Dutch Eredivisie), while others are notoriously tight and defensive. Before placing a bet, you should know the league averages for:
Once you know the baseline, you can spot the outliers. Is there a team in a low-scoring league that is consistently involved in high-xG matches? That’s a potential goldmine. The market might still be pricing their games based on the league average, giving you an edge.
Understanding these trends is vital for long-term success. If you’re serious about your process, you should also read up on mastering bankroll management to ensure you can weather the natural variance that comes with league-wide shifts.
The bookmakers use incredibly sophisticated AI algorithms to set their odds. If you’re just using your eyes and a basic league table, you’re essentially bringing a knife to a gunfight.

The beauty of modern technology is that you don’t need to be a data scientist to benefit from these stats. Tools like Smart Match Alerts do the heavy lifting for you.
Instead of spending hours manually checking xG and corner stats, you can set rules. For example: “Notify me when a game is 0-0 at 60 minutes, but the home team has an xG of over 1.5.”
This moves you away from emotional betting. You aren’t betting because you “fancy” a goal; you’re betting because the data tells you a goal is statistically overdue. It’s about working smarter, not harder.
A common mistake is thinking a team is “due” a win just because they’ve lost six in a row. Statistics don’t care about “destiny.” However, if their underlying numbers (like xG and shots on target) have been high throughout that losing streak, then: and only then: are they actually “due” for a turnaround.
To wrap things up, let’s create a quick mental checklist you can use before your next bet. Don’t just look at the odds; look at the performance indicators.
By following this simple framework, you’ll find yourself making much more informed choices. You won’t win every single time: that’s football: but you will be putting the odds in your favour over the long run.
If you’re ready to stop guessing and start using the same data the pros use, check out our full range of features to see how we can help you automate your research.
Never judge a team solely by their last result. A 4-0 win can sometimes be the result of four lucky deflections, while a 1-0 loss can be the result of a world-class performance from the opposition keeper. Always check the Expected Goals to see what actually happened on the pitch!