


Correlated Stats; we’ve all been there. It’s Saturday afternoon, you’ve got the early kick-off on the telly, and you’re scrolling through your betting app. You see the “Bet Builder” tab and start clicking.
Haaland to score? Obviously. City to win? Bank on it. Over 3.5 cards? They’re playing Leeds, so definitely. Over 8.5 corners? Sure, why not.
Suddenly, your £5 bet is looking at a £150 return. It feels like easy money. But then the game happens. Haaland scores a hat-trick, City win 4-0, there are 12 cards… but only 3 corners. The whole thing goes up in smoke because of one leg.
If this sounds familiar, don’t worry: you’re not alone. Most punters treat Bet Builders like a supermarket sweep, grabbing whatever looks “likely” without checking if those things actually belong together.
The truth is, your football betting strategy is probably failing because you aren’t accounting for correlated stats. In this post, we’re going to look at why your current approach is bleeding money and how you can use football stats for betting to build winners that actually make sense.
The reason bookies love Bet Builders (and promote them so heavily) isn’t just because they’re fun. It’s because the maths is heavily stacked in their favour.
When you add multiple selections into a single bet, you aren’t just adding the risks; you’re multiplying them. However, most people build their bets using “independent logic.” They think about each market as its own separate island.
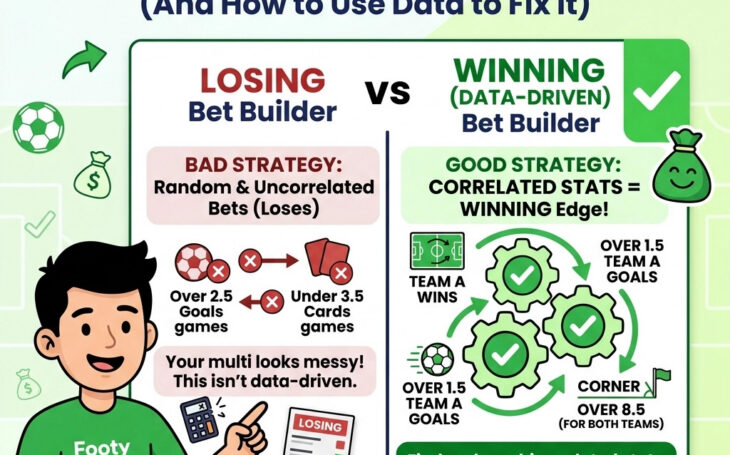
Imagine you bet on a team to win, but you also add “Under 1.5 Goals” to boost the odds. Statistically, most wins in the Premier League involve more than one goal. By combining these two, you’ve created a “negative correlation.” You’re betting on two things that are unlikely to happen at the same time.
Most punters fail because they don’t have a coherent narrative for the match. They pick outcomes that actually contradict each other, making the probability of winning almost zero, even if the odds look “juicy.”

If you want to turn the tide, you need to understand the secret sauce: Positive Correlation.
In simple terms, positive correlation is when one event happening makes another event more likely to happen. This is the foundation of any professional football betting strategy.
Think of it like telling a story. If your “story” for the match is that Liverpool will absolutely dominate a struggling Luton Town at Anfield, your selections should reflect that dominance in a way that links up.
By focusing on these links, you’re using football betting insights to ensure that if the main part of your prediction is right, the rest of the legs are dragged across the finish line with it.
It’s one thing to have a “feeling” that corners and possession go together, but it’s another thing to prove it with data. This is where most casual bettors fall down: they rely on their gut rather than the numbers.
To build a winning strategy, you need to look at historical data to see how teams actually behave. For example, some teams play with a “low block.” They might have very little possession but still win lots of corners on the counter-attack. If you just assumed “low possession = low corners,” your Bet Builder would fail.
This is exactly why we built Footy Amigo. Instead of guessing, you can use our smart football stats to see the real patterns.
For instance, you might find that whenever Arsenal plays at home against bottom-six sides, they average 8 corners and over 60% possession. That is a data-backed correlation. You can then use these predictions for today’s football to build a bet that actually has a statistical leg to stand on.

Even when punters start using data, they often fall into two classic traps: Overfitting and Confirmation Bias.
Overfitting is when you look at a very specific set of data and assume it will always happen. You might see that “Everton have had 10+ corners in their last two home games” and decide that’s a bankable trend.
But two games is a tiny sample size. It might have been a fluke. To fix this, you need to look at longer-term data: usually at least 10 to 20 games: to see if the trend is real. Check out our guide on the 5 habits of smart punters to see how pros avoid these pitfalls.
Data is great, but it doesn’t live in a vacuum. If a team’s main creative midfielder is out injured, their “High Possession” stat from the last six months might be useless. Always layer your data with current match context (injuries, suspensions, motivation).
So, how do you actually build a better bet? We suggest using an “Intent-Based” framework. Before you click a single selection, ask yourself: “What is the most likely way this game will be played?”
Break it down into three steps:
This framework ensures your bet isn’t just a list of random events, but a logical sequence. If the “Primary Outcome” happens, the “Support Legs” are statistically likely to follow.

The biggest mistake is trying to turn £2 into £2,000 every single weekend. Those massive 12-leg Bet Builders are essentially lottery tickets. The bookies love them because the “mathematical edge” they have over you increases with every leg you add.
If you’re serious about your football betting strategy, aim for smaller, highly correlated Bet Builders. Three or four legs that actually relate to each other are far more profitable in the long run than a 10-leg “hope and pray” special.
If you’re struggling with discipline or finding it hard to stay in the green, you might want to look at your bankroll management and how you’re tracking your bets.
When you start using football stats for betting properly, you stop being a gambler and start being a researcher. You’ll begin to notice that some markets are “undervalued” by bookmakers because they don’t account for how strongly certain stats are linked.
For example, a team might have a high “Over 1.5 Goals” percentage, but the bookie might still offer decent odds on their striker to score. If the team is scoring, the striker usually is too. That’s an edge you can exploit.

Before you place your next Bet Builder, perform the “Story Test.”
Read your selections out loud as a sentence.
“I think Manchester City will win a high-scoring game, where they have most of the ball, forcing lots of corners, and Haaland gets plenty of chances.”
If that sentence makes sense, you have a correlated bet.
If your sentence sounds like this: “I think Chelsea will win 1-0, but there will be 15 corners, 8 yellow cards, and the opposing goalkeeper will make 10 saves,” you’ve built a mess. You’re betting on a chaotic, contradictory game that is statistically very unlikely to happen.
Remember: Data doesn’t lie, but your gut often does. Use the numbers to find the correlations, and the winners will follow.
Want to stop guessing and start winning? Join thousands of smart punters using data to beat the bookies. Check out Footy Amigo’s features here and start building your data-driven strategy today.
[…] best systems are simple. They rely on core metrics like xG (Expected Goals), team form, and correlated stats that actually matter. If your system has 15 different filters, you’re likely just “fitting” it to the […]
[…] Footy Amigo, we’ve spent years looking at these patterns. We even wrote a deep dive on why correlated stats matter for your strategy. If you aren’t using data to see which stats actually “stick” […]