

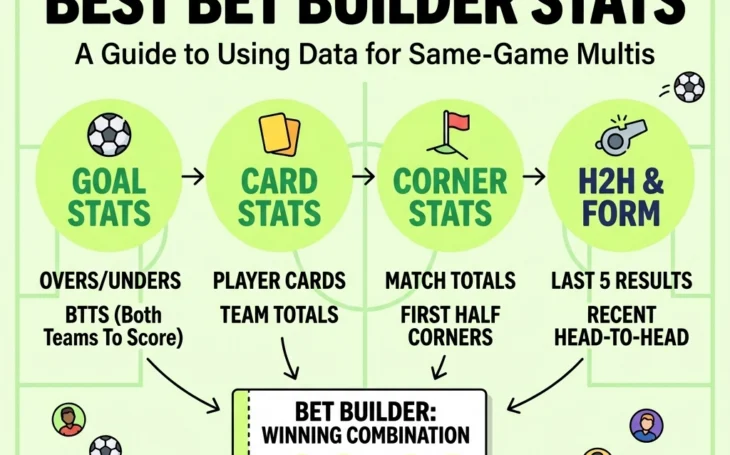
Bet Builder; let’s be honest for a second. We’ve all been there. It’s Saturday afternoon, you’re looking at a massive Premier League clash, and you think, “I fancy a Bet Builder.” You start clicking. Haaland to score? Obviously. Over 2.5 goals? Seems sensible. Both teams to get a card? Why not. Before you know it, you’ve got a 12-leg monster at 150/1 that has about as much chance of landing as I do of winning the Ballon d’Or.
Bet Builders (or Same-Game Multis) are brilliant fun, but the bookmaker’s margin grows with every leg you add, and most of us build them on “vibes” rather than data.
If you want to stop guessing and start building bets that actually have a statistical leg to stand on, you need to know which stats matter and how to use them. Grab a brew, and let’s dive into how to choose the best Bet Builder stats.
The biggest mistake punters make with Bet Builders is chasing the price instead of the probability.
Bookies love it when you add “just one more leg” to bump the odds from 5/1 to 20/1. But in the world of betting, every leg you add increases the “margin” the bookie takes. So be clinical. Turn each price into a probability (1 divided by the decimal odds), look at the data and ask: “Is the likelihood of this happening actually higher than the odds suggest?”
This is where betting analytics change the game. Instead of thinking “this game feels like it’ll have loads of corners,” you can check the record. This season Celtic have won 114 corners in 12 Scottish Premiership matches (9.50 a game), and Elversberg have conceded 63 in 8 Bundesliga matches (7.88 a game), in league matches up to 2 November 2026. That’s not a feeling; that’s a fact.

Every good Bet Builder starts with the big picture. You need to understand the “DNA” of the match before you worry about individual players.
Don’t just look at how many goals a team scores. Look at when they score them and where. Some teams are monsters at home but turn into shy kittens on the road.
At Footy Amigo, we always suggest looking at “Over/Under” percentages for the specific venue. If a team has seen Over 2.5 goals in 80% of their home games, that tells you more about their next home game than their overall season average, as long as the sample isn’t tiny.
Corners are a Bet Builder staple. But here’s a tip: don’t just look at the average total corners. Look at “Corners For” vs. “Corners Against.”
A team might have a high corner average because they concede loads, not because they win them. If you’re betting on a team to have “Over 4.5 Corners,” make sure they are a high-attacking side that utilizes wingers.
Elversberg are a good example this season. Their Bundesliga matches have averaged 12.00 corners, the second-highest in the league, but they have won only 33 of those 96 corners and conceded 63. Celtic’s league matches have averaged a similar 12.92 corners, and Celtic won 114 of the 155. Similar totals, very different team corner bets.
This is where the real value is hidden. Since Opta stats became mainstream, bookies have opened up markets for almost everything. Shots, tackles, fouls, even passes.
Shots on Target are arguably the most popular Bet Builder leg right now. But before you stick a striker in for 2+ SOT, you need to know the rules. For example, does a penalty count as a shot on target? (Spoiler: Yes, it does, provided it’s not blocked by someone other than the keeper or hits the woodwork).
Look for players who are “high volume” shooters. Some players might score a lot but only take one or two shots a game. Others will shoot from the car park if given half a chance. Those are the players you want for SOT markets. Consistency matters too: a player who has had a shot on target in each of his last eight games is a steadier leg than one who did it once three weeks ago.

Betting on cards is about two things: the player and the referee.
When choosing a player to be carded or to commit 2+ fouls, look at who they are marking. If a slow right-back is coming up against a tricky, fast winger who draws 3 fouls per game, you’ve found a statistical goldmine.
Also, check the referee. Some refs hand out cards like they’re confetti at a wedding; others are happy to let everything slide. If you have a high-foul player combined with a “strict” referee, that’s a match made in betting heaven.
This is the “pro” level of building Bet Builders. A correlation is when one event makes another event more likely to happen.
Most punters pick random stats that actually work against each other. For example, picking “Team A to win” and “Under 0.5 Match Goals.” Obviously, that’s impossible, but people often pick slightly less obvious contradictions, like “Team A to have 10+ corners” and “Team B Goalkeeper to make 0 saves.” If there are 10 corners, there’s a high chance some of those result in shots the keeper has to deal with!
Smart Correlations to look for:

Before you add a leg, it helps to know how often it has landed. Here are four common legs across the eight leagues in our weekly stats previews, from 776 league matches played this season up to 2 November 2026 (every score cross-checked against an independent results source; corner counts from football-data.co.uk):
| League | Matches | Over 2.5 | BTTS | BTTS and Over 2.5 | 10+ corners |
|---|---|---|---|---|---|
| Premier League | 90 | 46.7% | 47.8% | 36.7% | 46.7% |
| Championship | 156 | 61.5% | 62.2% | 51.3% | 57.1% |
| La Liga | 109 | 57.8% | 57.8% | 45.0% | 50.5% |
| Serie A | 100 | 61.0% | 58.0% | 50.0% | 44.0% |
| Bundesliga | 72 | 69.4% | 58.3% | 54.2% | 62.5% |
| Ligue 1 | 81 | 59.3% | 60.5% | 53.1% | 45.7% |
| Eredivisie | 99 | 71.7% | 68.7% | 59.6% | 54.5% |
| Scottish Premiership | 69 | 58.0% | 56.5% | 44.9% | 63.8% |
| All eight | 776 | 60.7% | 59.1% | 49.5% | 52.8% |
Look at the BTTS and Over 2.5 columns together. Across the eight leagues, 60.7% of matches went Over 2.5 and 59.1% had both teams scoring. If the two legs had nothing to do with each other, you would expect both to land in about 35.9% of matches. They actually landed together in 49.5%: 83.7% of the matches with both teams scoring also went Over 2.5. That is what a correlation looks like in real numbers, and it is why you should judge a Bet Builder price on the combination, not on each leg alone.
Corners show the “for v against” trap from Step 1 too. Home teams have averaged 5.47 corners a game and away teams 4.61, and home sides won more corners than away sides in every one of the eight leagues. For team-by-team records ahead of each weekend, see our weekend football stats preview.
The simplest discipline is to decide how you think the match will go before you pick a single leg, then make every leg fit that story. If your story is a cagey, defensive game, your legs might be Under 2.5 Goals, Under 10.5 Corners and Under 3.5 Cards. If it is a one-sided home win, they might be the home win, the home team to score Over 1.5 Goals and the home team to win Over 4.5 Corners.
Before you add a leg, ask yourself: “Does this leg make the others more likely to happen?” If the answer is “no” or “I don’t know,” take it out.
Be careful with player legs in particular. Your read of the match can be spot on and the bet still loses because a player is substituted early, picks up a knock or sees red. Every extra leg is one more thing that has to go right.
Doing this research manually takes ages. You’ve got better things to do, like actually watching the match or pretending to listen to your partner talk about their day.
This is why we built Footy Amigo. Instead of scrolling through endless spreadsheets, you can use our tools to find the “hot” stats in seconds.

Before you go and place that 14-fold life-changer, keep these rules in mind:
If you want to stay disciplined, try this simple framework for your next Bet Builder:
This keeps your bet grounded in data, provides decent odds, and doesn’t require a miracle for it to land.
Betting should be about making informed decisions, not just throwing darts in the dark. Use the data, understand the correlations, and most importantly, keep it fun.
Ready to put this into practice? See FootyAmigo plans and start your 5-day free trial
18+ only. Bet Builders combine several outcomes, so they lose more often than single bets: only stake what you can afford to lose. These statistics describe past matches and don’t guarantee future results. Footy Amigo is committed to supporting Responsible Gambling | www.gambleaware.co.uk